Introducing hl: The Blazing-Fast JSON Log Viewer for Serious Old School Developers


Table of Content
If you’ve ever stared at a wall of JSON logs, trying to find that one elusive error message while your terminal chugs like a 2008 laptop, stop. Breathe. There’s a better way.
Say hello to hl , the high-performance, no-nonsense log viewer and processor built for speed, precision, and sanity.
Whether you're debugging microservices, tailing Kubernetes pods, or sifting through terabytes of production logs, hl is your new secret weapon.
It transforms messy, machine-generated JSON and logfmt logs into clean, human-readable, color-coded clarity, at speeds that’ll make your old tools blush.
What Is hl?
hl (short for highlight or human log, depending on who you ask) is a command-line powerhouse designed for developers, SREs, and DevOps engineers who need to parse, filter, and analyze logs fast.
Built with performance as its core philosophy, hl can scan logs at up to 2 GiB per second, yes, gigabytes, and reindex growing files at a staggering 10 GiB/s by skipping unchanged blocks. That means no more waiting. No more timeouts. Just instant insights.
It’s like giving your logs a sports car engine.
 Hazem Abbas
What’s It Used For?
- Debugging complex systems (especially containerized or distributed apps)
- Monitoring real-time logs from Docker, Kubernetes, or cloud services
- Analyzing massive log files without crashing your terminal
- Filtering noise to focus only on what matters
- Automating log analysis in scripts and pipelines
Whether you’re chasing down a 500 error at 2 AM or auditing security logs across hundreds of servers, hl turns chaos into clarity.
 Hazem Abbas
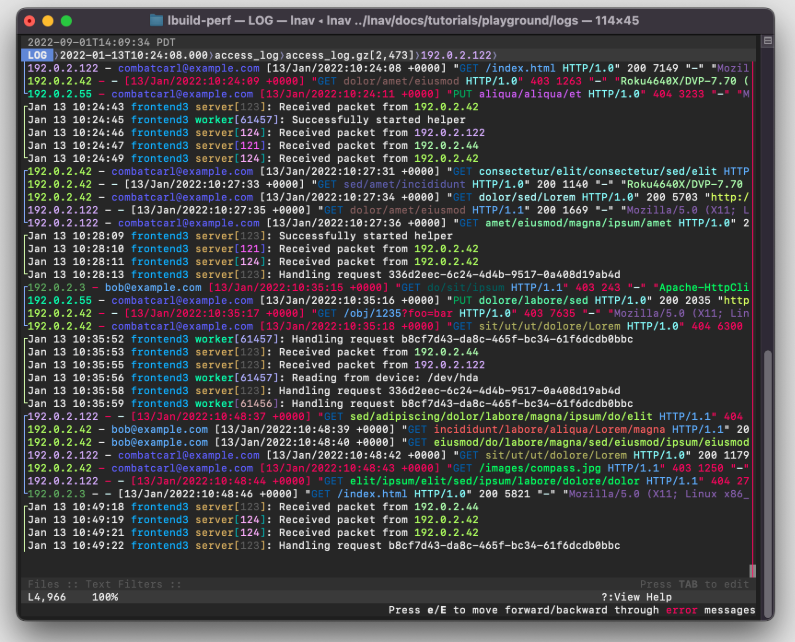
Killer Features That Make hl Unstoppable
Lightning-Fast Parsing & Indexing
- Scans logs at ~2 GiB/s
- Reindexes growing files at ~10 GiB/s using block-level diffing
- Automatic indexing for instant timestamp and level filtering
Smart Filtering, Your Way
- Filter by field:
-f user=johnor-f request.id=123 - Nested fields supported:
-f http.status=500 - Level filtering:
-l erroror-l warn - Timestamp ranges:
--since yesterday,--until -30m, or--since friday- Supports RFC-3339, relative times (
-2h), and natural shortcuts
- Supports RFC-3339, relative times (
Full Control Over Output
- Hide fields:
-h password,token - Hide empty fields:
-e - Customize timestamp format and timezone:
-Z Europe/Berlinor-Lfor local time - Toggle pager (default:
less) or stream with-P
Live Follow Mode
- Tail multiple files in timestamp-sorted order:
hl -F *.log - Preview recent logs with
--tail - Perfect for monitoring live services
Complex Query Support
- Combine filters with AND/OR logic
- Build advanced expressions for deep log spelunking
- Ideal for forensic analysis or compliance checks
 Hazem Abbas
Works With Real-World Logs
- Handles non-JSON prefixes (e.g., Docker logs) with
--allow-prefix - Supports both JSON and logfmt formats
- Plays nice with existing toolchains
Fully Customizable
- Themes for dark mode lovers, minimalists, and everyone in between
- Configure via files or environment variables
- Make it yours
Quick Tutorial: How to Use hl – The Blazing-Fast Log Viewer
hl is a powerful command-line tool that turns messy, machine-readable logs into clean, colorized, and searchable output, instantly. Whether you're dealing with Docker, Kubernetes, or giant JSON log files, hl makes your life easier and faster.
Let’s walk through real-world usage, step by step.
Step 1: Install hl
Make sure you have Go installed, then run:
go install github.com/observiq/hl/cmd/hl@latest
Or download a pre-built binary from the GitHub repo.
Add it to your PATH, and you're ready to go.
Install on macOS
brew install hlInstall on Linux
You can compile it from source on install it on Arch and Arch-based repos easily using Pacman.
Install on Windows
Using Scoop:
scoop bucket add pamburus https://github.com/pamburus/scoop-bucket.git
scoop install hl
Step 2: View a Log File
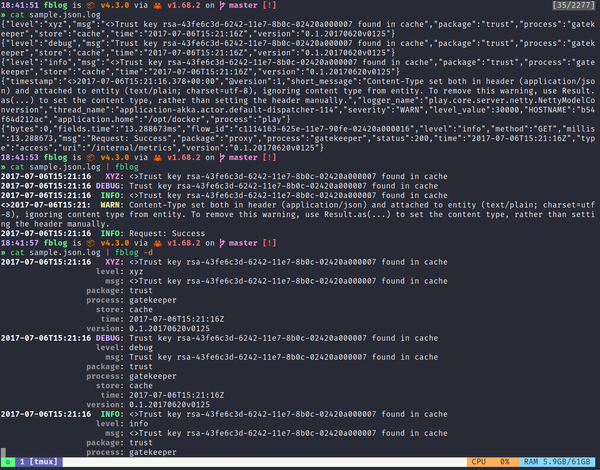
Start simple — view a JSON or logfmt log file:
hl app.log
Instantly see colorized, human-readable logs with timestamps, levels, and fields neatly formatted.
Tip: It automatically opens inless(the pager), so you can scroll, search (/error), and exit withq.
Step 3: Filter by Log Level
Quickly filter logs by severity:
hl app.log -l error      # Show only errors
hl app.log -l warn       # Show warnings and errors
hl app.log -l info       # Show info, warn, error (skip debug)
Perfect for cutting through noise.
Step 4: Filter by Time Range
Need logs from the last 3 hours?
hl app.log --since -3h
Or between specific times:
hl app.log --since "10:00 AM" --until "2:00 PM"
hl app.log --since yesterday --until now
Use natural language! today, friday, -1d, -45m — it all works.
Add -L to use local time instead of UTC:
hl app.log --since "Jun 19 11:22" -L
Step 5: Filter by Field Values
Search for logs where a field matches a value:
hl app.log -f component=tsdb
Exclude unwanted components:
hl app.log -f component!=tsdb -f component!=metrics
Search for substrings:
hl app.log -f provider~=aws    # contains "aws"
hl app.log -f 'method!~=GET'   # does NOT contain "GET"
Match nested fields (yes, really):
hl app.log -f 'request.method=POST'
hl app.log -f 'user.id=12345'
Even filter arrays:
hl app.log -f 'tags.[].name=urgent'
Step 6: Use Complex Queries
Combine conditions with and, or, not, and in:
hl app.log -q 'level >= warn or duration > 1.0'
Check if a field is in a list:
hl app.log -q 'request.id in (abc123, def456, xyz789)'
Or load values from a file:
hl app.log -q 'user.id in @blocked_users.txt'
Yes — hl can read filter lists from files or even stdin (in @-).
Step 7: Work with Multiple & Compressed Files
Concatenate and view all logs in a directory:
hl *.log
Include compressed files (gzip, zstd, etc.):
hl $(ls -tr /var/log/app/*.{log,log.gz,log.zst})
Automatically detects compression — no extra steps.
Step 8: Live Tail Logs (Like tail -f)
Stream logs in real time:
tail -f app.log | hl -P
The -P flag disables the pager so logs flow live.
Or follow multiple files and sort them chronologically:
hl -F --tail 100 app1.log app2.log
This is gold for microservices, see logs from multiple sources, merged and time-sorted!
You can even follow live kubectl logs:
hl -F <(kubectl logs -l app=myapp -f)
Step 9: Customize Output
Hide noisy fields:
hl app.log -h password -h token
Hide everything except one field:
hl app.log -h '*' -h '!user.email'
Hide empty fields:
hl app.log -e
Change time format:
hl app.log -t '%Y-%m-%d %H:%M:%S.%3N'
Or set via env:
HL_TIME_FORMAT='%T.%3N' hl app.log
Step 10: Themes & Colors
Use a built-in theme:
hl app.log --theme classic
hl app.log --theme uni
List all themes:
hl --list-themes
Preview themes interactively with fzf:
hl --list-themes | fzf --preview="hl --theme {} sample/*.log"
Create custom themes in ~/.config/hl/themes/.
Step 11: Configuration & Environment
Create a config file at ~/.config/hl/config.yaml:
time_format: "%b %d %T"
time_zone: "America/New_York"
theme: classic
hide_empty_fields: true
Or use environment variables:
export HL_THEME=dark
export HL_LEVEL=error
export HL_TIME_ZONE=Europe/Berlin
hl app.log  # uses your defaults
Pro Tips
- Disable color if needed:
--color=never - Output raw filtered logs:
hl app.log -f error -r > errors.json - Check performance:
hl --dump-index(in sort mode)
Use -s to sort logs chronologically across files:
hl -s *.log
You’re Now a Log Ninja
With hl, you can:
- Scan gigabytes in seconds
- Filter with precision
- Follow live logs across services
- Customize everything
It’s not just a log viewer — it’s a superpower.
Get hl now: github.com/observiq/hl
And never grep a JSON log again. 🔥
License
MIT License
Resources & Downloads
 pamburus