24 Open-source Free Log Viewers for Windows, Linux, macOS, and The Web


Table of Content
As a developer who's spent countless nights wrestling with mysterious application crashes, I can tell you one thing: log viewers are absolute lifesavers. If you're still opening log files in Notepad and scrolling through thousands of lines manually, we need to talk.
What Exactly IS a Log Viewer?
Think of a log viewer as your debugging microscope. It's a specialized application designed to parse, display, and analyze log files that would otherwise look like incomprehensible walls of text. These tools transform raw log data into structured, searchable, and filterable interfaces that actually make sense.
Unlike basic text editors, log viewers understand log formats, can highlight different log levels (INFO, WARN, ERROR), and provide real-time monitoring capabilities. They're essentially the difference between finding a needle in a haystack blindfolded versus using a metal detector.
Who Actually Uses These Tools?
Spoiler alert: It's not just sysadmins in server rooms.
- Backend developers like me rely on them daily to trace API call failures
- DevOps engineers use them to monitor container health across Kubernetes clusters
- Security analysts hunt for intrusion patterns in system logs
- QA engineers debug test automation failures
- Support teams troubleshoot customer issues without pestering developers
- Even data engineers parse through ETL pipeline logs to spot data quality issues
If you write code that runs in production, you're probably already using logs, you just might not be using the right tool to read them.
Why Bother with Log Viewer Apps?
Let me paint you a scenario: Your production app crashes at 2 AM. You SSH into the server and find a 2GB log file. What do you do?
Without a proper log viewer, you're essentially:
- Grepping through massive files (slow and error-prone)
- Missing critical patterns in the noise
- Wasting hours on manual analysis
With a good log viewer, you get:
- Instant filtering by timestamp, log level, or custom fields
- Real-time tailing without overwhelming your system
- Pattern recognition and anomaly detection
- Export capabilities for post-mortem analysis
- Multi-file correlation to trace request flows across services
The Elephant in the Room: Large Logs
Here's where most developers hit a wall. Modern applications generate terrifying amounts of log data. We're talking hundreds of megabytes to several gigabytes per day, especially in microservices architectures.
Basic text editors choke on files larger than a few hundred MB. They load everything into memory, freeze your system, and make searching feel like watching paint dry.
Professional log viewers handle large logs through:
- Streaming parsers that read files incrementally
- Memory-mapped file access for instant navigation
- Indexing mechanisms for lightning-fast searches
- Smart buffering to keep only relevant portions in memory
Tools like Splunk, ELK Stack, or even desktop apps like Glogg or LogExpert are built specifically to handle this scale.
Types of Logs You'll Encounter
Not all logs are created equal, and understanding the taxonomy helps you choose the right viewing approach:
- Application Logs: Your bread and butter – custom logs from your code
- System Logs: OS-level events (syslog on Linux, Event Viewer on Windows)
- Web Server Logs: Apache/Nginx access and error logs
- Database Logs: Query performance, connection issues
- Security Logs: Authentication attempts, firewall blocks
- Container Logs: Docker/Kubernetes pod outputs
- Audit Logs: Compliance and user activity tracking
Each type has its own structure and conventions. Good log viewers adapt to these formats automatically.
Are Cars DLT Logs? Let's Demystify This
You might be wondering about DLT logs – especially if you work in automotive or embedded systems. Diagnostic Log and Trace (DLT) is indeed a specialized logging format, primarily used in automotive applications.
DLT logs contain:
- Timestamped diagnostic messages from vehicle ECUs
- Trace information for debugging automotive software
- Structured payloads with automotive-specific data types
While general-purpose log viewers might struggle with DLT format, specialized tools like dlt-viewer (from the GENIVI project) are designed specifically for automotive diagnostics. These tools understand the proprietary formats and can decode the complex data structures used in vehicle systems.
So yes, cars absolutely generate DLT logs, and they require specialized viewing tools.
 Hazem Abbas
Open-source Free Log Viewer Apps
1- LNAV – The Logfile Navigator
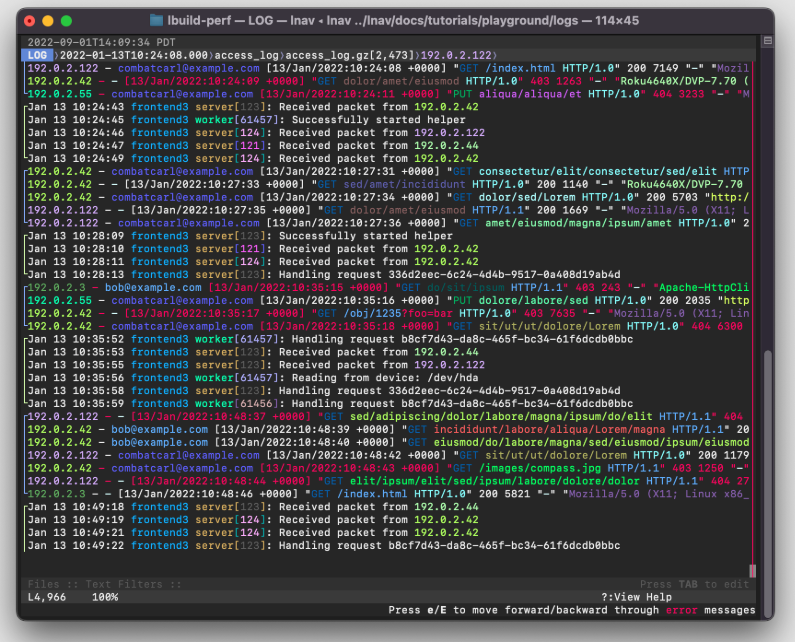
lnav (Logfile Navigator) is a powerful terminal tool that automatically decompresses, detects formats, and merges multiple log files into a unified, time-sorted view. It tails files in real time, follows log rotations, and discovers new logs in directories.
lnav indexes errors and warnings, highlights syntax, supports filtering and search, and even allows SQL queries on structured logs. With smart parsing, real-time monitoring, and deep terminal integration, lnav turns chaotic log analysis into a fast, intuitive, and efficient experience, making it an essential tool for developers and sysadmins alike.
However, it does not stop there, It also comes with a TUI that enables you to browse your logs quickly, easily, filter them, and highlight lines with simply your mouse.
It works smoothly on Linux, Windows, macOS also on Server.
 tstack
2- Graylog
Graylog is a free and self-hosted, open log management platform. It is written with Java, TypeScript, and works seamlessly on the cloud!
 Graylog2
3- Klogg
Klogg is a multi-platform GUI application that helps browse and search through long and complex log files. It is designed with programmers and system administrators in mind and can be seen as a graphical, interactive combination of grep, less, and tail.
It is originally started as a fork of glogg, the open-source smart log explorer.
Features
- Supports large files
- Uses Perl-compatible regular expressions (PCRE)
- Search results displayed in a dedicated panel, separate from the original log
- Combine regex patterns with boolean operators (AND, OR, NOT)
- Limit searches to specific file regions (e.g., time ranges or byte offsets)
- Supports many common text encodings
- Detects file encoding automatically using uchardet library (supports utf8, utf16, cp1251 and more)
- Can limit search operations to some part of huge file
- Allows to configure several highlighters sets and switch between them
- Has a list of configurable predefined regular expression patterns
- Includes a dark mode
- Has configurable shortcuts
- Has a scratchpad window for taking notes and doing basic data transformations
- Provides lots of small features that make life easier (closing tabs, copying file paths, favorite files menu, etc.)
- Is heavily optimized using multi-threading and SIMD
- Supports files with more than 2147483647 lines
- Includes much faster regular expressions search (2-4 times)
- Allows combining regular expressions with boolean operators (AND, OR, NOT)
 Hazem Abbas
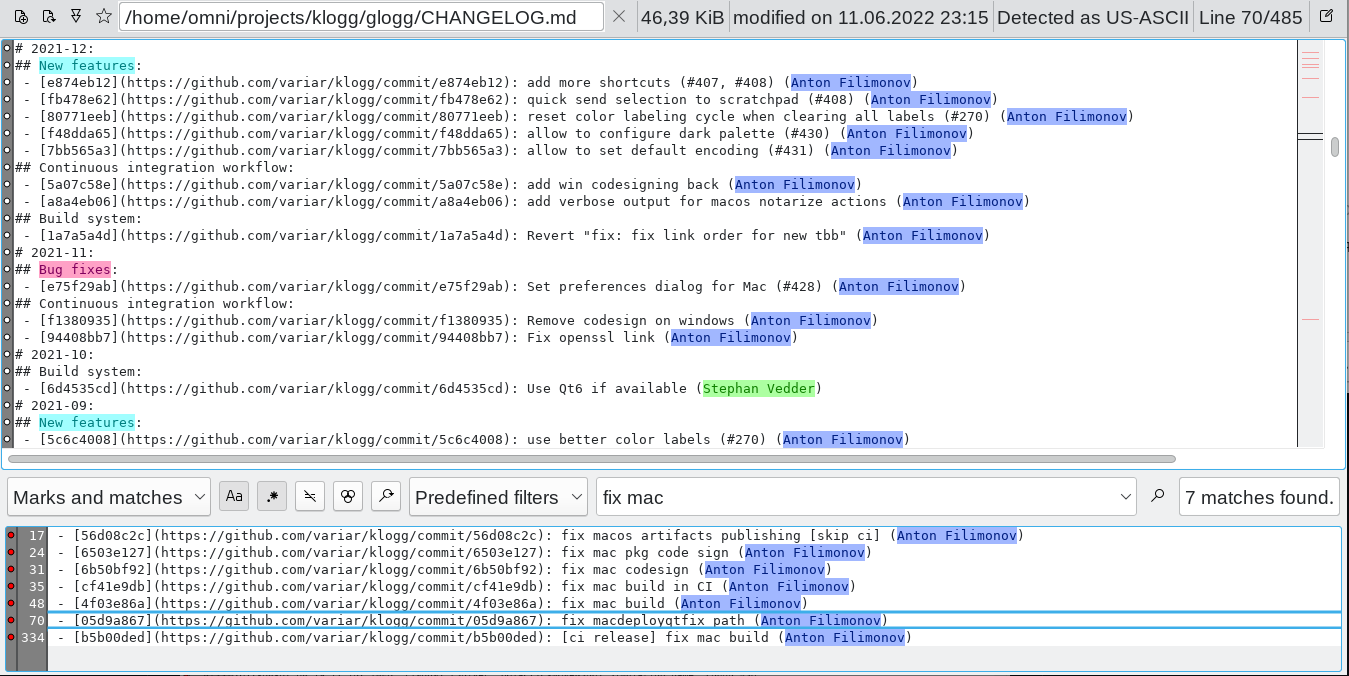
4- glogg
glogg is a multi-platform GUI application to browse and search through long or complex log files. It is designed with programmers and system administrators in mind. glogg can be seen as a graphical, interactive combination of grep and less.
It supports large files by default, up to 10+ GB, and watches for file changes, easily.
It works on Windows, Linux and macOS.


5- Logdy: terminal logs in web browser
Logdy is a lightweight, single-binary log viewer that works just like grep, awk, sed, or jq. Simply add it to your PATH, no installation, deployment, or compilation required. It runs entirely locally, ensuring security and privacy.
Its features include:
- Zero-dependency single binary
- Embedded Web UI
- Real-time log viewing and filtering
- Secure local operation
- Multiple input modes (files, stdin, sockets, REST API)
- Custom parsers and columns with TypeScript support (code editor with types support)
- Go library integration
6- YScope Log Viewer
The YScope Log Viewer is a tool that can be used to view log files. It currently supports CLP's compressed log files (IR streams) and JSON log files.
The viewer can be used to navigate the log file, filter by log level, view the logs with syntax highlighting, and generate direct links to specific log events.
 Hazem Abbas
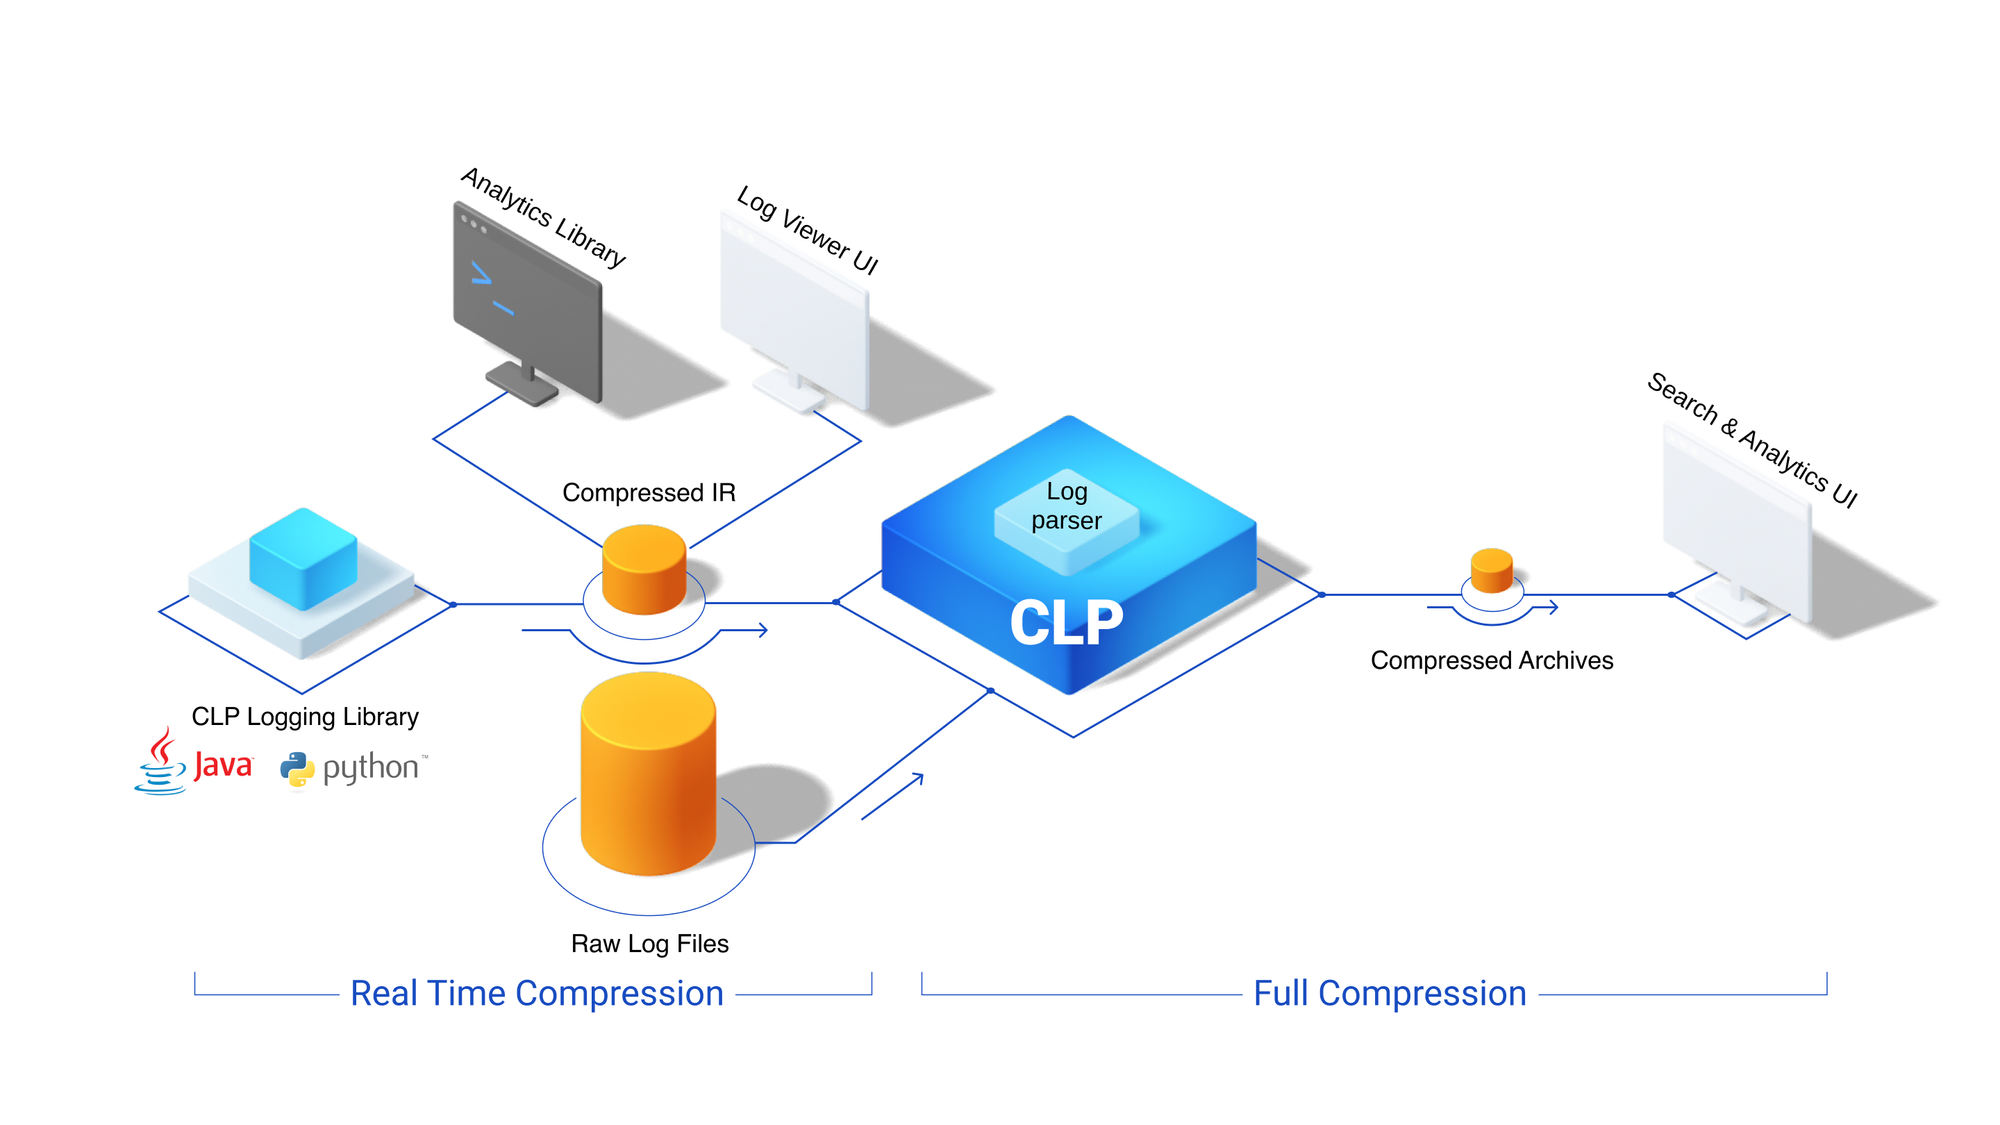
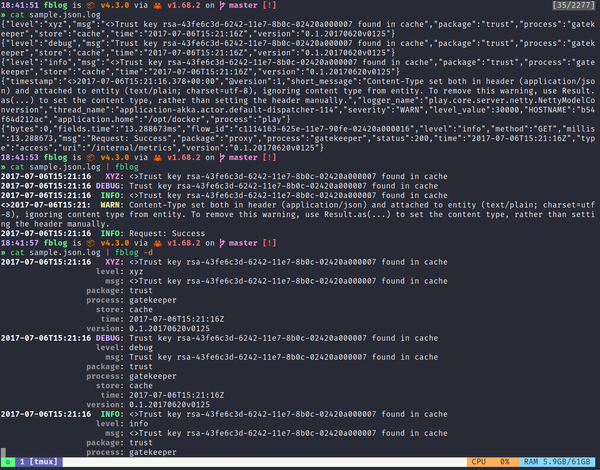
7- hl
hl is an open-source high-performance log viewer and processor that transforms logs in JSON and logfmt formats into a human-readable output. Built with efficiency in mind, it enables quick parsing and analysis of large log files with minimal overhead.
 pamburus
8- LogViewer
LogViewer is an easy-to-use tool intended to help with the analysis of Android logs. this app, you can open multiple log files at once and it will present you a single merged output containing all the logs already ordered by timestamp. This is very useful when you have different files for ‘main’, ‘system’ and ‘radio’ logs, for example. Or simply if your logs are broken down in multiple files.
It also allows you to apply different filters on the set of logs, displaying a single filtered output, differentiating each filter by color. Filters can be as simple as a single word, or as complex as you want using regex.
It is written in Kotlin, and can run on Windows, Linux and macOS as a Jar file.
- Multi-File Support: Open and merge multiple Android log files (e.g., main, system, radio, kernel, events) at once.
- Chronological Merging: Automatically sorts all logs by timestamp into a single, unified timeline.
- Dual View Panel:
- All Logs, Full log stream for context.
- Filtered Logs, Only lines matching active filters, color-coded for clarity.
- Lexible Filtering:
- Filter by simple keywords or complex regex patterns.
- Each filter has a custom name and color.
- Apply multiple filters simultaneously.
- Filter Navigation:
- Jump between matches using
,(previous) and.(next). - See occurrence count for each filter (e.g.,
{905}).
- Jump between matches using
- Filter Groups:
- Organize filters into reusable groups.
- Save and load filter sets for different projects or use cases.
- Stream Detection:
- Automatically identifies Android log streams (main, radio, system, etc.) from file names.
- Visual indicators show which stream each log line belongs to.
- Enable/disable streams on the fly via the toolbar.
- Bug Report Parsing:
- Fully parses
.bugreportfiles. - Displays logs in the Logs tab and metadata (packages, carrier config, properties) in the Bug Report tab.
- Fully parses
- Regex Editor:
- Built-in real-time regex tester with syntax highlighting.
- Invalid regex is highlighted in red for quick debugging.
- Drag & Drop Support: Easily add log files by dragging them into the app.
- Command-Line Support: Launch LogViewer with files directly:
java -jar LogViewer.jar log1.txt log2.txt - Cross-Platform: Works on Windows, macOS, and Linux (Java-based).
- User-Friendly UI:
- Dark-friendly interface.
- Configurable shortcuts.
- Reorder filters via drag & drop.
- Scratchpad for notes (optional).
9- Jaeger
Jaeger is a powerful, open-source distributed tracing platform originally developed at Uber and now part of the Cloud Native Computing Foundation (CNCF). It is designed to help developers and operators monitor, troubleshoot, and optimize applications built using microservices architectures.
In complex distributed systems, a single user request can travel through dozens of services. Jaeger captures the full journey of these requests, providing end-to-end visibility into how data flows across your infrastructure.
Features
- Distributed Tracing: Tracks requests as they flow across multiple services, showing the complete path and timing of each operation.
- Performance Monitoring: Visualizes how long each service call takes, helping you identify slow components and latency bottlenecks.
- Root Cause Analysis: Enables fast troubleshooting by showing exactly where failures or delays occur in a distributed workflow.
- High Scalability: Built to handle high-volume environments, making it suitable for large-scale production systems.
- Cloud Native: Designed for cloud environments and integrates seamlessly with Kubernetes, OpenTelemetry, and other CNCF projects.
- Open Source: 100% open source under the Apache 2.0 license, with strong community and enterprise support.
- Search & Filtering: Allows you to search traces by service, operation, duration, tags, and more for quick diagnostics.
- Visualization: Provides clear, timeline-based trace views that show spans, durations, and annotations across services.
- Sampling Support: Offers multiple sampling strategies to manage data volume without losing critical insights.
- Integration-Friendly: Works with popular instrumentation libraries like OpenTelemetry and supports multiple data stores (e.g., Elasticsearch, Cassandra).
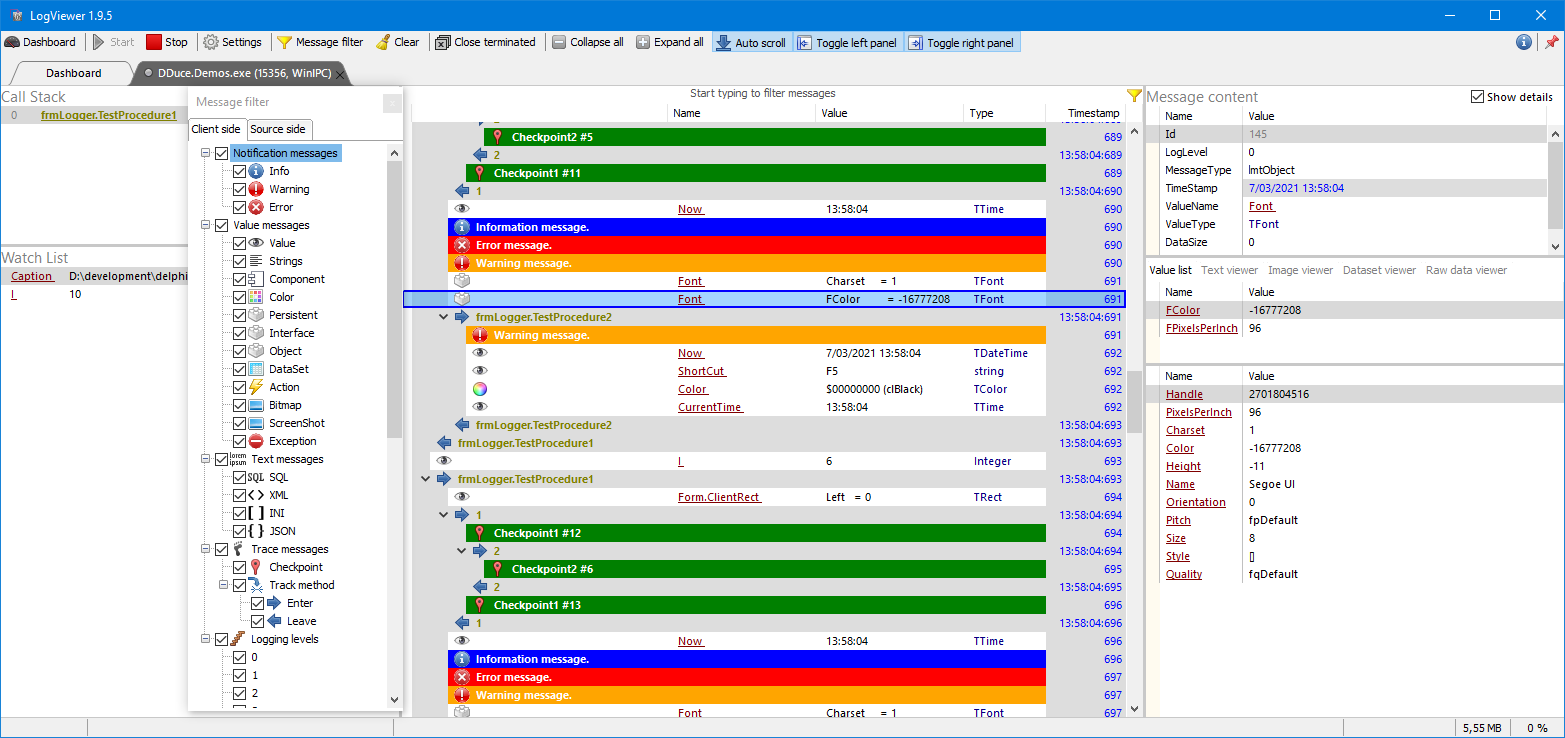
10- Analogy Log Viewer
This is a free and open-source customizable Log Viewer with ability to create custom providers. Can be used with C#, C++, Python, Java and others.
Features
- Standalone Winform User Control to show log messages
- Aggregation into single view.
- Search in multiple files
- Combine multiple files
- Compare logs
- Themes support
- 64 bit support (allow loading more files)
- Personalization (users settings per user)
- Columns Extendable: Ability to add more columns specific to the data source implementation
- Exporting to Excel/CSV files
- Collaboration-like feature: ability to send log messages to gRPC/WCF service and/or between data providers
 Analogy-LogViewer
11- Tailviewer
Tailviewer is a free, actively maintained open-source log file viewer designed for developers and system administrators. It is compatible with Windows 7, 8, and 10, and requires .NET Framework 4.7.1 or later to run.
Features
- Multiline log entries
- Searching
- Filtering (substring, wildcard & regexp)
- Filter by timestamp range
- Filtering by log level (fatal, error, warning, info and debug)
- Highlighting by log level
- Merging multiple files (by timestamp)
- Bookmarks
- Additional columns:
- Elapsed time between log entries
- Elapsed time since first log entry
- Plugin system to support custom/proprietary formats (submitting an issue/mr is also an option, if I have the time)
 Hazem Abbas
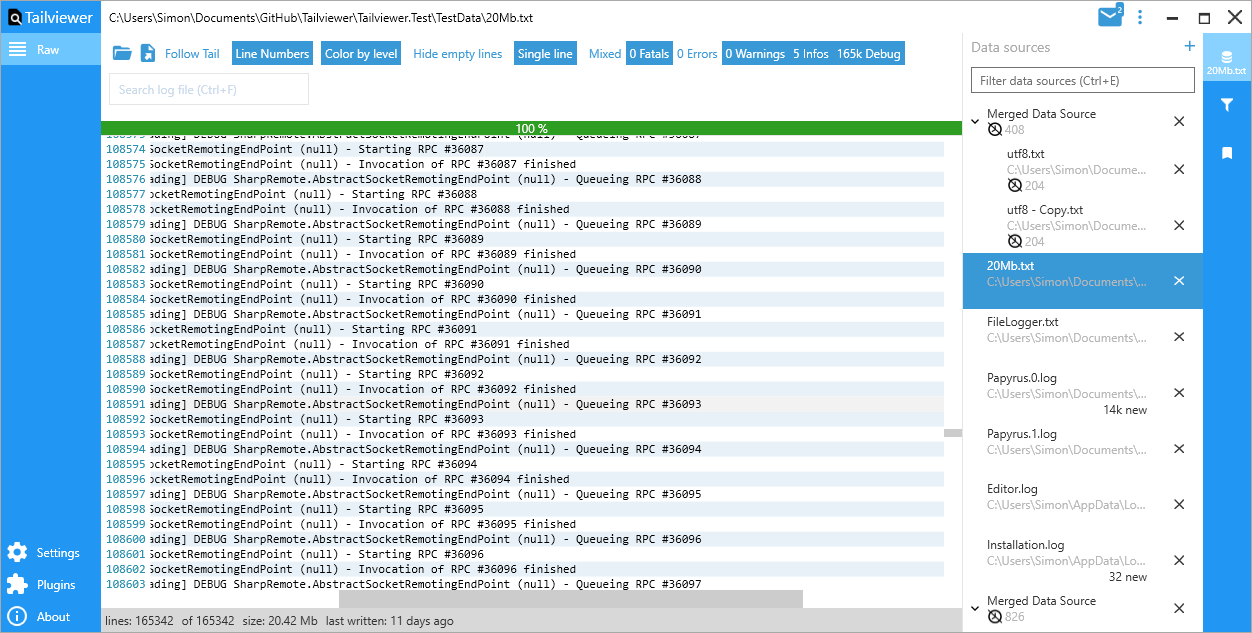
12- Frontail – streaming logs to the browser
frontail is a Node.js application for streaming logs to the browser. It's a tail -F with UI.
Features
- log rotation (not on Windows)
- auto-scrolling
- marking logs
- pausing logs
- number of unread logs in favicon
- themes (default, dark)
- highlighting
- search (
Tabto focus,Escto clear) - set filter from url parameter
filter - tailing multiple files and stdin
- basic authentication
 mthenw
13- Advanced Log Viewer (Windows)
Advanced Log Viewer (ALV) is a free, powerful, and lightweight log viewing tool built for developers and system admins who need speed, flexibility, and advanced features without the bloat.
Engineered for Windows, it runs smoothly on modern systems with no external dependencies—thanks to being built on .NET 5 as a self-contained app.
 Scarfsail
14- Nerdlog
Nerdlog is a fast, remote-first, multi-host TUI log viewer with timeline histogram and no central server. Loosely inspired by Graylog/Kibana, but without the bloat. Pretty much no setup needed, either.
It's laser-focused on being efficient while querying logs from multiple remote machines simultaneously, filtering them by time range and patterns, while also drawing an interactive timeline histogram for quick visual insight.
Features
- Remote-First Architecture: Query logs directly from remote servers over SSH—no need to download full log files.
- Multi-Host Support: View and analyze logs from multiple Linux hosts simultaneously in a single interface.
- No Central Server Required: Works without Graylog, ELK, or any centralized logging infrastructure, just SSH access.
- Efficient Remote Processing: Log filtering and time-range queries are executed on the remote machines; only relevant data is sent back.
- Timeline Histogram: Interactive visual timeline shows log volume over time, enabling quick identification of spikes or quiet periods.
- Low Bandwidth Usage: Only metadata and a limited number of log entries (default: up to 250 per stream) are transferred, compressed with gzip.
- Supports Large Log Files: Handles multi-gigabyte logs efficiently (e.g.,
/var/log/syslog,/var/log/messages,journalctloutput). - Built-In Journalctl Support: Can read directly from
journalctlon systemd-based systems. - Flexible Log Sources: Works with various log formats and custom log files, not just system logs.
- Configurable Pagination: Browse through logs page by page, with control over how many entries are fetched per request.
- Custom SSH/Shell Commands: Supports alternative access methods like Teleport, Mosh, or bastion hosts by allowing custom connection commands.
- TUI (Terminal User Interface): Fast, keyboard-driven interface designed for efficiency and ease of use in the terminal.
- Time-Based Filtering: Filter logs by specific time ranges to focus on relevant events.
- Pattern & Regex Search: Filter logs using text patterns or regular expressions across multiple hosts.
- Unified Log View: Merges and correlates log entries from all connected hosts into a single, chronologically sorted stream.
- Minimal Effortless Setup: No agents, no servers, no complex configuration—just install and connect via SSH.
 dimonomid
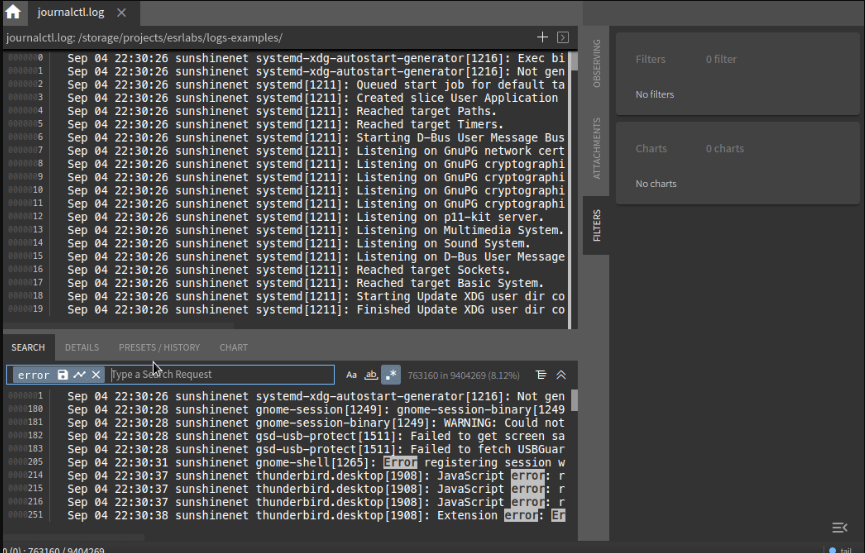
15- LazyJournal
LazyJournal is a fast, terminal-based log viewer written in Go, designed for developers who love productivity and simplicity. It supports logs from journald, auditd, files, Docker, Podman, and Kubernetes pods, offering real-time viewing, syntax coloring, fuzzy search, regex filtering, and timestamp navigation, all in a sleek, intuitive TUI built with gocui. Inspired by LazyDocker and LazyGit, it’s a joy to use for quick, efficient log inspection across modern containerized environments.
Features
- Simple installation, to run download one executable file without dependencies and settings.
- Centralized search for the required journal by filtering all lists (log sources).
- Streaming output of new events from the selected journal (like
tail). - List of all units (
services,sockets, etc.) with current running status viasystemctlfromsystemd. - View all system and user journals via
journalctl(tool for reading logs from journald). - List of all system boots for kernel log output.
- List of audit rules from
auditdfor filtering by keys and viewing ininterpretformat. - File system logs such as for
ApacheorNginx, as well assyslog,messages, etc. from/var/log. - Lists all log files in users home directories, as well as descriptor log files used by processes.
- Reading archive logs truncated during rotation (
gz,xzandbz2formats), Packet Capture (pcapformat) and Apple System Log (aslformat). - Search and analyze all logs from remote hosts in one interface using rsyslog configuration.
- Docker logs from the file system or stream, including build-in timestamps and filtering by stream.
- Podman logs, without the need to run a background process (socket).
- Kubernetes pods (need to configure a connection to the cluster via
kubectlin advance). - Windows Event Logs via
PowerShellandwevtutil, as well as application logs from Windows file system.
 Lifailon
16- Telescope (Self-hosted)
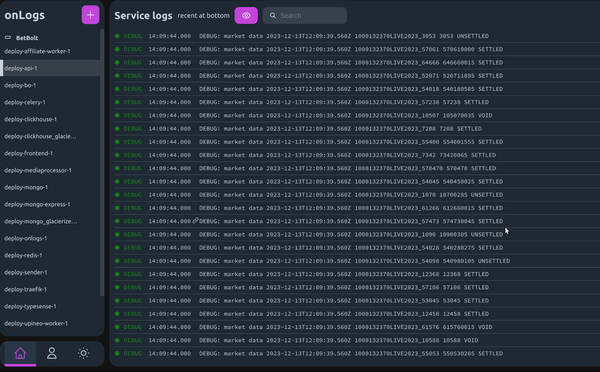
Telescope is a self-hosted web-based tool built to make log exploration simple and intuitive. It supports multiple log sources, with native integration for ClickHouse and Docker. Users can connect directly to ClickHouse databases for structured, high-performance log querying, or pull container logs in real time using the Docker API.
Telescope offers a consistent, user-friendly interface across all sources, enabling powerful filtering, searching, and analysis. While ClickHash serves as the main backend for production-scale logging, Docker support is ideal for local development and temporary environments. Expanded source integrations are planned for future releases.
Telescope Key Features
- Multi-Source Support: Connect and manage logs from ClickHouse and Docker.
- Source Management: Create and configure multiple data source connections.
- Field Configuration: Choose which log fields to display, hide, suggest, or enable autocompletion for.
- Access Control: Define which users and groups can access each source and set their permissions.
- Role-Based Access Control (RBAC): Assign granular permissions based on user roles and groups.
- GitHub Authentication: Secure login via GitHub with optional enforcement of organization membership.
- Dynamic Data Explorer: Explore logs with interactive graphs and visualizations.
- Customizable Columns: Select and rearrange visible log fields for a personalized view.
- Powerful Filtering: Apply filters to narrow down log data quickly and efficiently.
- Relative Time Ranges: Use intuitive time selectors (e.g., “last 15 minutes”, “last 24 hours”) for time-based queries.
- Graph Grouping: Group data in visualizations, including support for nested fields (JSON, Maps, Arrays).
- Raw SQL Queries: Run advanced ClickHouse SQL
WHEREclauses for precise, custom filtering. - Minimalist UI: Clean, focused interface designed for distraction-free log analysis.
- Real-Time Log Access: View container logs on-demand via the Docker API.
- Scalable for Development & Production: Ideal for local debugging with Docker and high-performance querying with ClickHouse.
17- LogNote
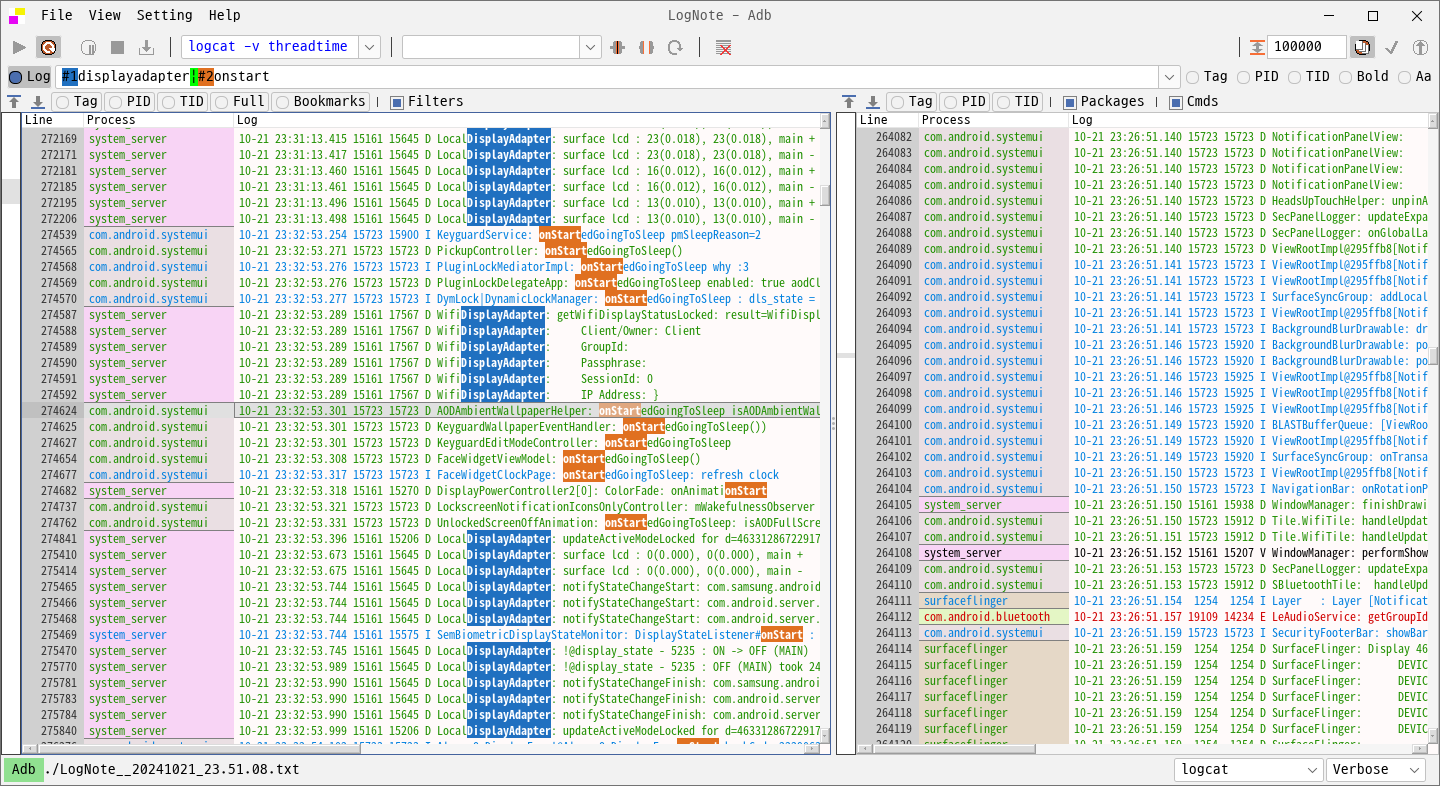
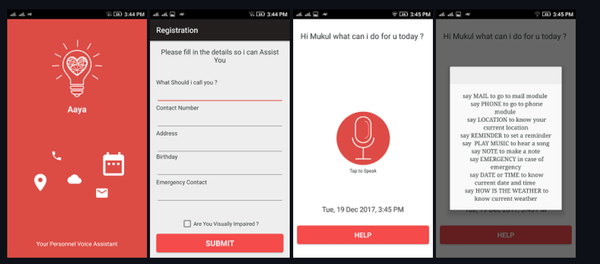
Log Viewer is a lightweight, open-source logcat viewer built for Android developers working on Windows, Linux, and macOS. Written in Kotlin with Swing, it offers a smooth desktop experience for viewing and analyzing Android application logs in both online (real-time) and offline (saved log files) modes.
Key features include powerful regular expression filtering, allowing developers to zero in on specific log patterns, and an aging test mode that automatically splits and saves log files by line count, ideal for long-running tests and performance monitoring.
With its clean interface and focused functionality, Log Viewer makes debugging Android apps faster and more efficient, especially during development and QA testing. It’s a simple yet effective tool for anyone who works closely with Android logcat output.
Written in Kotlin, and it can run on Windows, Linux and macOS.
 cdcsgit
18- LogViewer
LogViewer is a Web application for monitoring server logs in real-time in the browser. The tool provides powerful UI with highlighting, filtering, search, folding inconsiderable text. Merging several logs into one view works as well.
LogViewer can show huge log files without significant resource consumption because it reads only the part of the file that a user is watching. No indexing.
Written with Java, expected to run on all platforms.
 sevdokimov
19- chipmunk
Chipmunk is one of the fastest desktop log viewers available, designed to handle log files of any size, whether 1 GB, 2 GB, or even 10 GB. Limited only by your available disk space, it opens massive files instantly without caching or copying data unnecessarily.
Beyond file viewing, Chipmunk supports real-time log collection through network inputs like TCP, UDP, and Serial, as well as from the output of running commands, making it a powerful, versatile tool for developers and system administrators.
 esrlabs
20- binjr
If you work with time-stamped data, logs, metrics, events, or performance counters, binjr is the tool you’ve been waiting for. More than just a time series browser, binjr transforms raw data into dynamic, interactive visualizations that you can shape in real time.
It is built for speed, flexibility, and deep exploration, it lets you drag and drop time series from multiple sources into customizable views, then refine them with zoom, filters, and editable chart types—all with a fluid, intuitive interface.
Features
- Standalone Client-Side Application: Runs independently, no server or backend components required.
- Multi-Source Connectivity: Connect to multiple data sources of different types simultaneously.
- API-Based Communication: Pulls data directly through the APIs exposed by each source.
- Plugin-Extensible Architecture: Supports new data sources via plugins for future growth.
- Supports Numeric & Text Time Series: Visualize both numeric metrics (charts) and log entries (text) on the same timeline.
- Ad-Hoc View Composition: Build custom dashboards on the fly with flexible, user-driven layout.
- Drag-and-Drop Series: Add time series to charts simply by dragging them from any source.
- Cross-Source Visualization: Mix and overlay series from different sources in a single view.
- Multi-Axis Charts: Overlay charts with multiple Y-axes and a shared timeline for complex comparisons.
- Highly Customizable Views: Adjust chart types, colors, transparency, legends, labels, and more.
- Session Saving: Save your entire workspace to a file and reopen or share it later.
- Smooth Navigation:
- Mouse-driven zoom on both X (time) and Y (value) axes
- Drag-to-pan for easy timeline navigation
- Browser-style forward and backward history (zoom/pan navigation)
- Advanced Time-Range Picker: Select absolute or relative time ranges with precision.
- Detachable Tabs: Turn chart tabs into separate, movable windows.
- Time Synchronization: Sync timelines across multiple chart windows for coordinated analysis.
- Fast & Responsive UI: Handles dozens of charts, each with many series and thousands of data points, without lag.
- Modern Visuals with JavaFX: Hardware-accelerated graphics for smooth rendering and a polished look.
- Three UI Themes: Light, Dark, and System themes to match your OS or preference.
- Java-Based & Cross-Platform: Runs on Windows, macOS, and Linux with consistent performance and appearance.
 binjr
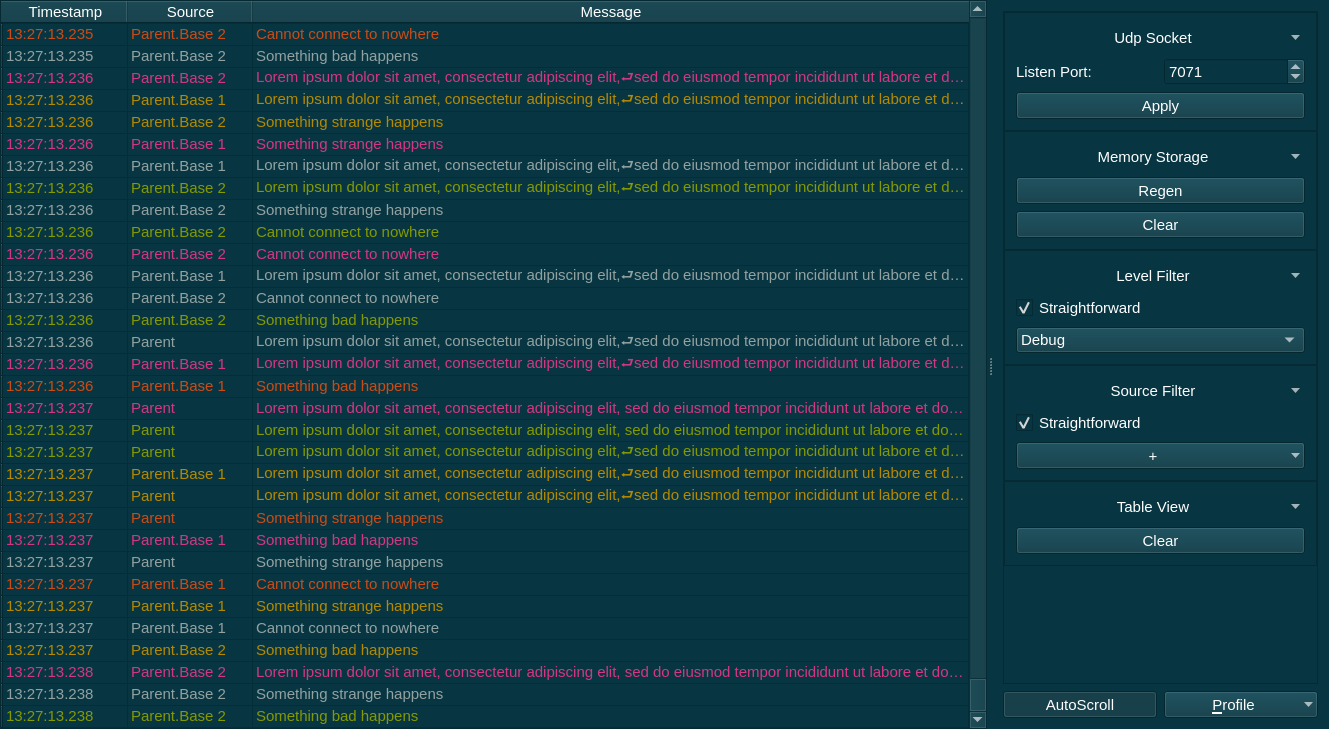
binjr21- LogViewer
LogViewer is a general purpose message viewer for log messages with support for multiple sources to receive messages from. The application is a modular design which can easily be extended to support other message types and transfer protocols.
It currently supports Windows IPC (WM_COPYDATA) and ZeroMQ PUB/SUB for high-performance network logging, with serial ports, OutputDebugString, and MQTT support in development. Built for extensibility, it allows multiple subscribers to view messages from the same source in separate windows.
It is an ideal choice for debugging distributed systems, IoT, and cross-platform applications, flexible, fast, and developer-friendly.
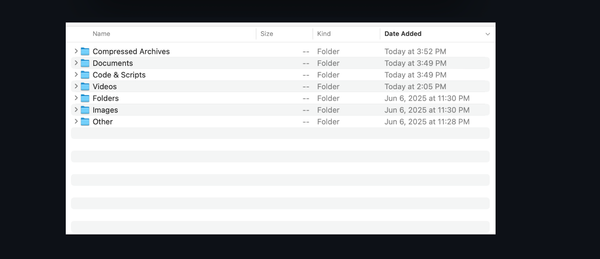
22- LogoRRR
LogoRRR is a powerful desktop application designed to simplify the analysis of text files for recurring patterns. Whether you’re searching for specific events in log files or analysing any other type of text file, LogoRRR makes the process effortless and efficient.
It offers:
- Easy Pattern Recognition: Quickly identify recurring patterns in your text files.
- Versatile Application: Perfect for log file analysis, but adaptable to any text file.
- User-Friendly Interface: Designed with simplicity and ease of use in mind.
Its features include:
- Cross-Platform Compatibility: Easily use on Windows, macOS, Linux.
- Drag and Drop: Just drag and drop log files or directories for instant access.
- Interactive Filtering: Effortlessly filter log entries to find exactly what you need.
- Multi-File Handling: Manage and view multiple log files simultaneously.
- Zip File Support: Directly work with zip files - no need to unpack data before analyzing.
- Advanced Search Options: Utilize case-sensitive and regex searches for precise results.
- Real-Time Monitoring: Stay updated with Unix
tail -flike functionality for ongoing events. - Efficiency at Your Fingertips: Quick keyboard shortcuts streamline your workflow.
- Easy export: Copy your extracted data to the clipboard - to include it in emails for example.
- Remembers settings:
LogoRRRsmartly recalls your last files and settings on restart.
 rladstaetter
23- antilogviewer
antilogviewer is yet another log viewer for log4j library and its various ports for other languages. It has good performance, small memory footprint and flexible filter system, and of course, dark theme.
Features
- High Performance: Filters are applied efficiently, no constant reprocessing on every action.
- Lightweight & Fast: Optimized for speed and responsiveness, even with large log files.
- Low Memory Usage: Designed to minimize memory footprint by filtering out irrelevant logs early.
- Flexible Filter System: Multi-level filtering (like Wireshark), capture filters to reduce data, display filters to refine view.
- Modular Filter Chains: Easily configure and stack multiple filters for precise log inspection.
- Dark Theme: Built-in dark mode for comfortable, long-term use.
- Simple & Maintainable Code: Built with KISS principle, easy to understand, modify, and extend.
- Qt-Based UI: Uses Qt for a responsive, cross-platform interface with good virtualization support.
- Open Source & Free: Licensed under MPL-2.0, free to use, modify, and integrate, even in commercial projects.
- Extensible Architecture: Designed to be extended with custom filters and input sources.
 anticodeninja
24- Vim Log Highlighting
Vim Log Highlighing is a Vim extension that provides syntax highlighting for generic log files in VIM.
Some of the highlighted elements are:
- Dates and times
- Common log level keywords like ERROR, INFO, DEBUG
- Numbers, booleans and strings
- URLs and file paths
- IP and MAC addresses
- SysLog format columns
- XML Tags
 MTDL9
MTDL9Pro Tips for Choosing Your Log Viewer
- For local development: Tools like lnav, LogExpert, or Glogg work great
- For production monitoring: Consider ELK Stack, Splunk, or Datadog
- For automotive/embedded: Look into dlt-viewer or Vector CANoe
- For cloud-native apps: Fluentd + Kibana combo is powerful
The key is matching your tool to your log volume, format, and use case. Don't try to use a hammer when you need a scalpel.
Final Thoughts
Log viewers aren't just nice-to-have tools – they're essential infrastructure for modern software development. Whether you're debugging a pesky race condition or investigating a security incident, these tools amplify your effectiveness exponentially.
Invest time in learning your log viewer of choice. Master its filtering capabilities, understand its search syntax, and explore its advanced features. Trust me, your future self at 2 AM will thank you.
What's your go-to log viewing tool? Are you still struggling with massive log files? Drop a comment below, let's help each other debug smarter, not harder.
Read More
 Hazem Abbas
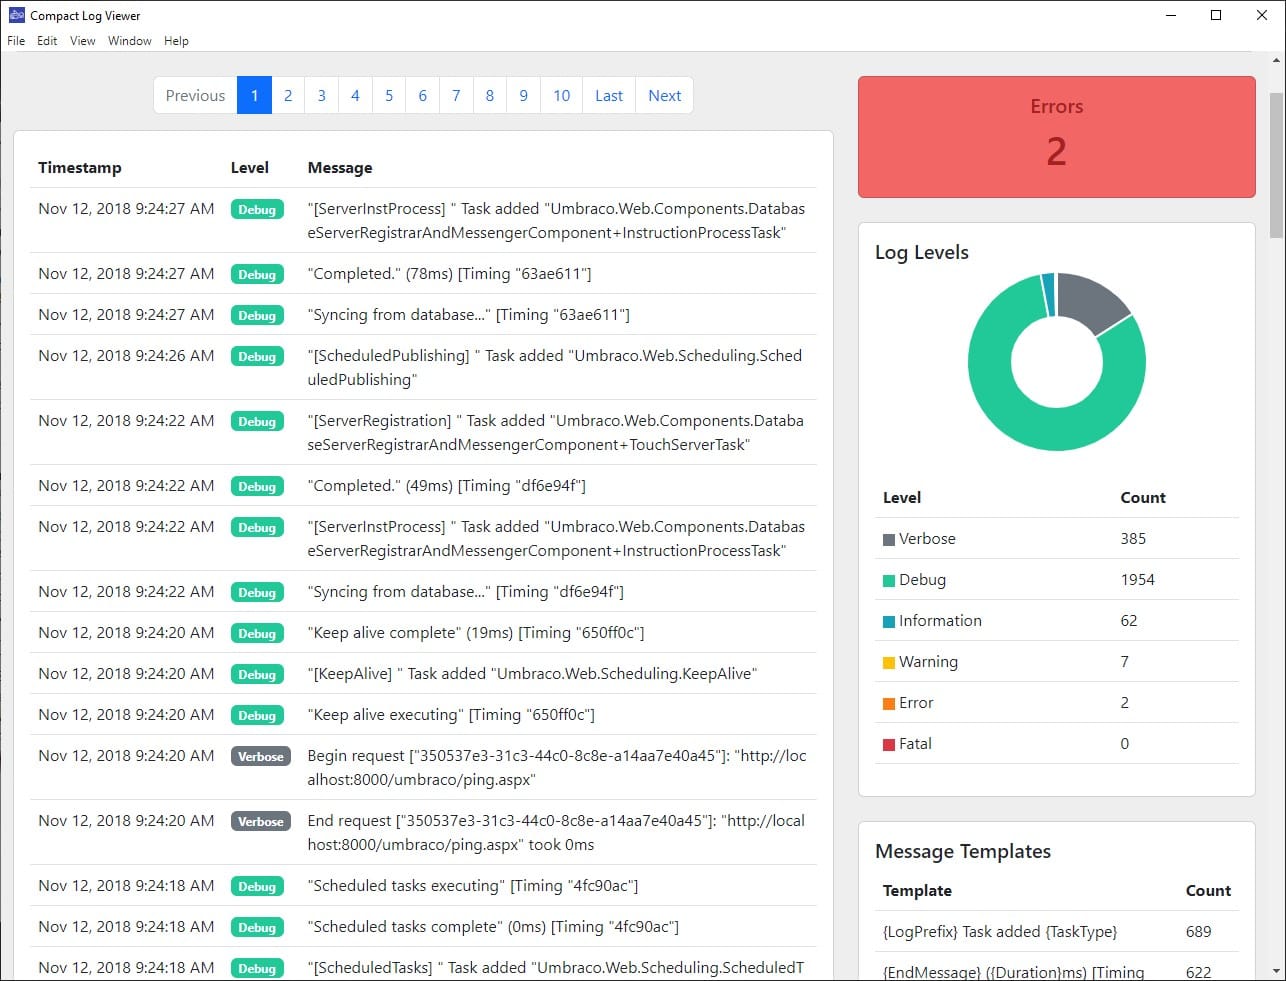
 Hazem Abbas
 Hazem Abbas
 Hazem Abbas
Analyze Your Firewall Logs with Web-based Firewall Log Analyzer